Python/Study
[Python] 서울 5대 범죄 현황 분석
Yoppie
2024. 1. 20. 12:31
반응형
import pandas as pd
import numpy as np
In [2]:
# 데이터 불러오기
In [3]:
cctv = pd.read_csv('서울cctv.csv')
In [4]:
pop = pd.read_csv('서울인구.csv')
In [5]:
crime = pd.read_csv('서울범죄.csv',encoding='utf-8')
In [6]:
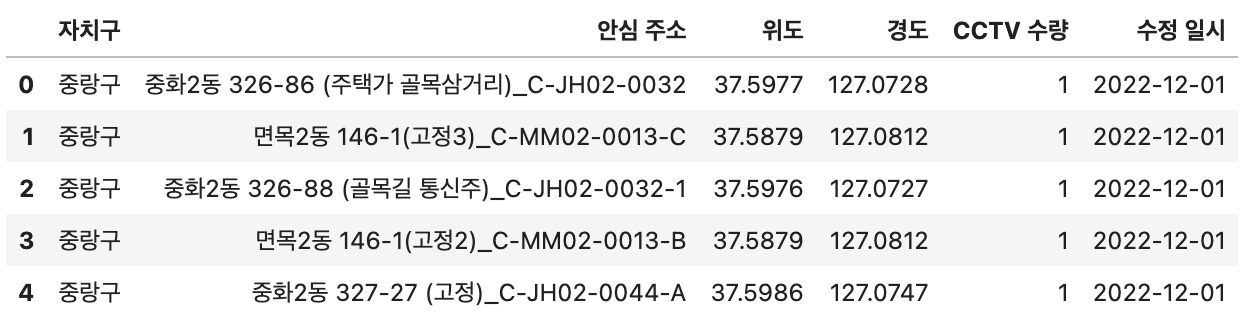
cctv.head()
Out[6]:
In [7]:
pop.head()
Out[7]:

In [8]:
# 컬럼명 변경

pop.rename(columns = {'동별(2)':'자치구', '구분별(1)':'국적', '구분별(2)':'성별', '데이터':'인구수'}, inplace=True)
In [9]:
crime.head()
Out[9]:

# 필요없는 컬럼 삭제

cctv.drop(columns = ['수정 일시'], inplace=True)
pop.drop(columns = ['시점'], inplace=True)
In [11]:
pop['동별(1)'].unique()
Out[11]:
array(['합계'], dtype=object)In [12]:
pop.drop(columns = ['동별(1)'], inplace=True)
In [13]:
cctv.info()
<class 'pandas.core.frame.DataFrame'>
RangeIndex: 83734 entries, 0 to 83733
Data columns (total 5 columns):
 #   Column   Non-Null Count  Dtype
---  ------   --------------  -----
 0   자치구      83734 non-null  object
 1   안심 주소    83734 non-null  object
 2   위도       83734 non-null  float64
 3   경도       83734 non-null  float64
 4   CCTV 수량  83734 non-null  int64
dtypes: float64(2), int64(1), object(2)
memory usage: 3.2+ MB
In [14]:
pop.info()
<class 'pandas.core.frame.DataFrame'>
RangeIndex: 100 entries, 0 to 99
Data columns (total 4 columns):
 #   Column  Non-Null Count  Dtype
---  ------  --------------  -----
 0   국적      100 non-null    object
 1   성별      100 non-null    object
 2   자치구     100 non-null    object
 3   인구수     100 non-null    int64
dtypes: int64(1), object(3)
memory usage: 3.3+ KB
In [15]:
crime.info()
<class 'pandas.core.frame.DataFrame'>
RangeIndex: 310 entries, 0 to 309
Data columns (total 4 columns):
 #   Column  Non-Null Count  Dtype
---  ------  --------------  -----
 0   구분      310 non-null    object
 1   죄종      310 non-null    object
 2   발생검거    310 non-null    object
 3   건수      310 non-null    int64
dtypes: int64(1), object(3)
memory usage: 9.8+ KB
In [16]:
crime['구분'].unique()
Out[16]:
array(['중부', '종로', '남대문', '서대문', '혜화', '용산', '성북', '동대문', '마포', '영등포',
       '성동', '동작', '광진', '서부', '강북', '금천', '중랑', '강남', '관악', '강서', '강동',
       '종암', '구로', '서초', '양천', '송파', '노원', '방배', '은평', '도봉', '수서'],
      dtype=object)
In [17]:
crime.rename(columns={'구분':'관서'}, inplace=True)
In [18]:
# crime데이터에 자치구 정보 추가를 위한 경찰서 정보 데이터 불러오기

pol = pd.read_csv('서울경찰서.csv')
In [19]:
pol.head()
Out[19]:

In [20]:
# 관서명 변경
In [21]:
pol['관서'] = pol['관서'].str.replace('서울', '')
pol['관서'] = pol['관서'].str.replace('경찰서', '')

pol
# 자치구 컬럼 생성
In [23]:
pol['자치구'] = pol['주소'].str.split(' ').str[1]
In [24]:
pol.drop(columns = ['주소'], inplace=True)
In [25]:
# crime 데이터와 합치기
In [26]:
crime = pd.merge(crime, pol, on = '관서')
In [27]:
crime
Out[27]:

In [28]:
# pivot하여 데이터 정리
crime.drop(columns = ['관서'], inplace=True)

crime = crime.pivot_table(crime, index=['자치구'],
                          columns=['죄종', '발생검거'],
                          aggfunc=[np.sum])
crime
# Null값 0으로 대치

crime = crime.fillna(0)
crime.isnull().sum()
Out[29]:
         죄종     발생검거
sum  건수  강간     검거      0
                발생      0
         강간,추행  검거      0
                발생      0
         강도     검거      0
                발생      0
         살인     검거      0
                발생      0
         절도     검거      0
                발생      0
         폭력     검거      0
                발생      0
dtype: int64
In [30]:
# sum, 건수 컬럼명 삭제

crime.columns = crime.columns.droplevel([0, 1])
crime.head()
Out[30]:

In [31]:
# 레벨0, 레벨1의 컬럼명을 합쳐 컬럼명 변경

tmp = [
    crime.columns.get_level_values(0)[n] + " "
    + crime.columns.get_level_values(1)[n]
    for n in range(0, len(crime.columns.get_level_values(0)))
]
crime.columns = tmp
crime.head()
Out[31]:

In [32]:
# 검거율 계산

target = ["강간 검거율", "강간,추행 검거율", "강도 검거율", "살인 검거율", "절도 검거율", "폭력 검거율"]
num = ["강간 검거", "강간,추행 검거", "강도 검거", "살인 검거", "절도 검거", "폭력 검거"]
den = ["강간 발생", "강간,추행 발생", "강도 발생", "살인 발생", "절도 발생", "폭력 발생"]

crime[target] = crime[num].div(crime[den].values)
crime.head()
Out[32]:

In [33]:
# 검거 삭제

crime.drop(columns = ["강간 검거", "강간,추행 검거", "강도 검거", "살인 검거", "절도 검거", "폭력 검거"], inplace=True)
In [34]:
# 컬럼명 변경

crime.rename(
    columns={"강간 발생" : "강간", "강간,추행 발생" : "강간,추행", "강도 발생" : "강도", "살인 발생" : "살인", "절도 발생" : "절도", "폭력 발생" : "폭력"},
    inplace=True
)
col = ["강간", "강간,추행", "강도", "살인", "절도", "폭력"]
col2 = ["강간 검거율", "강간,추행 검거율", "강도 검거율", "살인 검거율", "절도 검거율", "폭력 검거율"]
# 사건 발생 수 최소-최대 정규화
crime_norm = (crime[col]-crime[col].min())/(crime[col].max()-crime[col].min())
crime_norm[col2] = crime[col2]
crime_norm.head()
Out[36]:

In [37]:
# 검거율 DF

crime_rate = crime_norm.drop(columns = ["강간", "강간,추행", "강도", "살인", "절도", "폭력"])
In [38]:
import seaborn as sns
import matplotlib.pyplot as plt
import platform

from matplotlib import font_manager, rc
plt.rcParams['axes.unicode_minus'] = False

if platform.system() == 'Darwin':
    rc('font', family='AppleGothic')
elif platform.system() == 'Windows':
    path = "c:/Windows/Fonts/malgun.ttf"
    font_name = font_manager.FontProperties(fname=path).get_name()
    rc('font', family=font_name)
else:
    print('Unknown system... sorry~~~~')


plt.figure(figsize=(10, 8))
sns.heatmap(crime_rate, annot=False, cmap="YlGnBu")
plt.show()

# 인구수 데이터 국적, 성별 컬럼 삭제

pop = pop.groupby('자치구').sum()
pop.drop(columns = ["국적", "성별"], inplace=True)
pop
# cctv 데이터와 인구수 데이터 합치기
seoul = pd.merge(cctv, pop, on='자치구')fp1 = np.polyfit(seoul['인구수'], seoul['CCTV 수량'], 1)
f1 = np.poly1d(fp1)
fx = np.linspace(100000, 700000, 100)
plt.figure(figsize=(14, 10))
plt.scatter(seoul['인구수'], seoul['CCTV 수량'], s=50)
plt.plot(fx, f1(fx), ls='dashed', lw=3, color='g')
plt.xlabel('인구수')
plt.ylabel('CCTV 수량')
for n in range(25):
plt.text(seoul['인구수'][n], seoul['CCTV 수량'][n], seoul.index[n], fontsize=10)
plt.grid()
plt.show()

- 인구수가 많을수록 CCTV수량이 많은 것으로 보임
In [48]:
# 상관계수

seoul.corr()
Out[48]:

In [49]:
# 범죄 데이터와 합치기

seoul_crime = pd.merge(seoul, crime_norm, on='자치구')
y1 = seoul_crime["강도 검거율"]
y2 = seoul_crime["강도"]
plt.plot(seoul_crime.index, y1, color = 'red')
plt.plot(seoul_crime.index, y2, color = 'blue')
plt.show()

In [52]:
crime_norm.corr()
plt.figure(figsize=(10, 8))
sns.heatmap(crime_norm.corr(), cmap = "RdBu_r", annot=False)
plt.show()

In [54]:
sns.pairplot(seoul_crime, vars=["인구수","CCTV 수량","강도 검거율"], kind="reg", height=3)
plt.show()

In [55]:
sns.pairplot(seoul_crime, vars=["인구수","CCTV 수량","살인 검거율"], kind="reg", height=3)
plt.show()

In [56]:
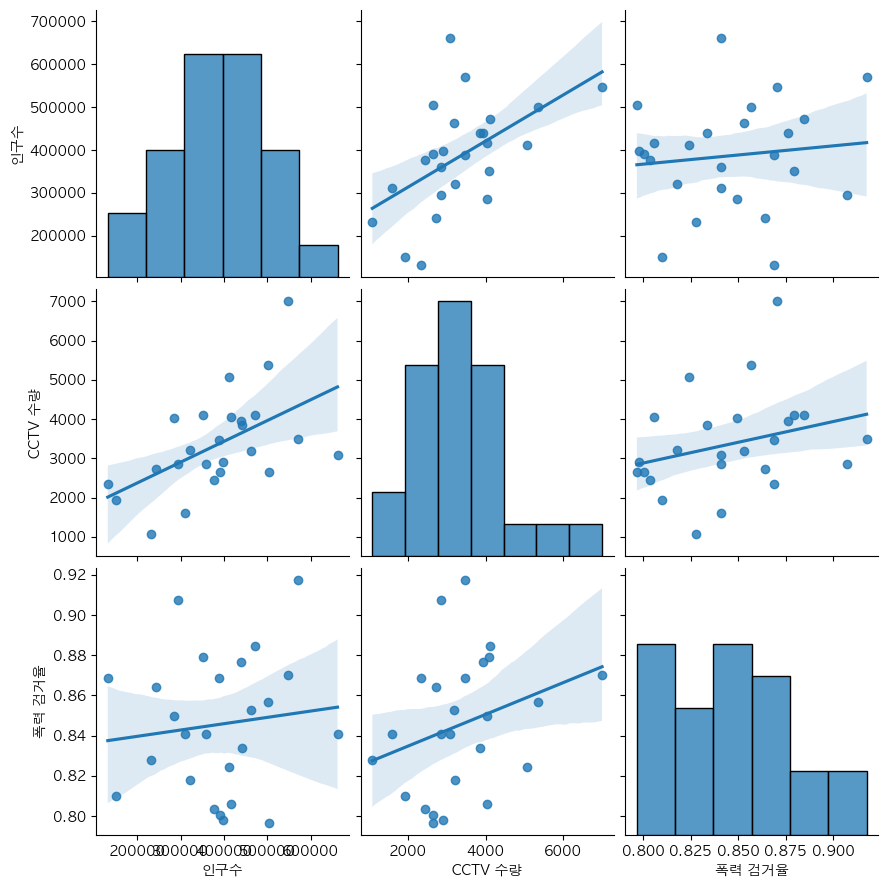
sns.pairplot(seoul_crime, vars=["인구수","CCTV 수량","폭력 검거율"], kind="reg", height=3)
plt.show()
In [57]:
corr = seoul_crime.corr()
plt.figure(figsize=(10, 8))
sns.heatmap(corr, cmap = "RdBu_r", annot=False)
plt.show()

반응형